 | |


| All about Russian forests | Russian NGOs Forest Club | Useful links | Site map | Site search |
|
| |||
| ||||
|
|
|
Atlas of Russia’s Intact Forest Landscapes Method for delineation of intact forest landscapesA three-step procedure was used to exclude non-intact areas and delineate remaining intact landscapes:
Additional information, such as forest inventory maps at the level of leskhoz (local office of the state forest management agency) and other thematic maps, were used at all stages of the analysis. Verification was done through a number of field expeditions, mostly in European Russia, and by using high-resolution images for spot checking the interpretation of medium-resolution images.
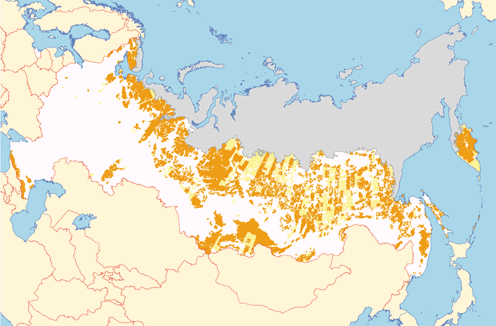
This approach was adopted because of information constraints associated with both cost and availability. The step-wise approach made it possible to exclude large areas from further analysis on the basis of readily available and affordable information. This led to significant savings in working time and data cost. The most important elements of each step of the analysis are described below. A more detailed description is given in the book The Last Intact Forest Landscapes of Northern European Russia (Yaroshenko et al., 2001). Step 1. Reduction of the initial candidate area (the total area of the forest zone) by elimination of areas in the vicinity (i.e. within buffer zones) of infrastructure as well as landscape fragments smaller than 50,000 hectaresThe main source of information at this stage was topographical maps at the scale of 1:500,000.The quality of these maps can be rather low. Therefore, only major elements of infrastructure (i.e. that could, within reason, be assumed to be reliably depicted on a general map) were taken into account. A list of such elements and the width of their maximum zone of disturbance (buffer zone) is provided in Table 1. Occasionally, these maps show elements of infrastructure that do not exist on the ground or which are incorrectly classified. Such errors were corrected at subsequent stages of analysis with the aid of satellite images. The goal at this first stage was to reduce the initial candidate areas under examination (the forest zone of Russia) by excluding obviously disturbed areas from further analysis. Major elements of infrastructure were excluded at this stage, together with a buffer zone surrounding them. Remaining landscape fragments were also excluded if their size was smaller than the minimum viable size for an intact forest landscape, i.e. 50,000 hectares (123,500 acres). The first stage of the analysis produced a map of landscapes without roads greater than 50,000 hectares in size (Picture 5). Smaller roads and other linear objects, such as geological survey lines, forest roads, and winter roads, were not taken into account at this stage.
Table 1. Types of infrastructure considered in the analysis of landscape fragments undivided by constantly used roads and settlements, and the width of their assumed area of disturbance on each side of the object
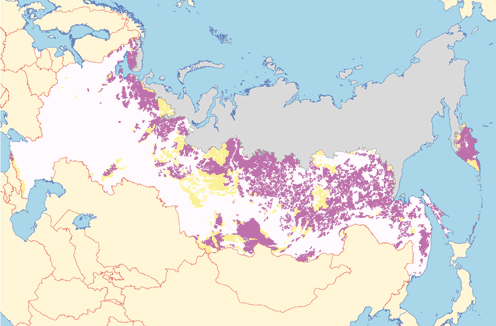
Step 2. Reduction of the remaining candidate area (roadless landscapes greater than 50,000 hectares) by elimination of areas with larger surface disturbances, visible in satellite images with a resolution of 150-300 metersThe main source of information at this stage was satellite images from two different sources: summer and winter images from Resurs-O1 MSU-SK (resolution 150 meters, 771 scenes), and Landsat ETM+ Quicklooks (resolution approximately 300 meters, 8900 scenes).The goal at this second stage was to further reduce the candidate area (the map of roadless areas produced in step 1 by excluding large areas disturbed by contemporary land-use practices that could be positively identified in images of medium resolution, including typically large agricultural fields, clear cuts, and quarries (see Table 2). Burned areas adjacent to infrastructure were also excluded (see the section on forest fires above). The individual disturbed areas that were excluded at this stage varied in size between 30-50 hectares (74-124 acres) and 150-200 hectares (370-494 acres), approximately. Smaller disturbed areas and other areas not positively identifiable in these images were not taken into account at this stage (i.e. were retained until the next stage). The disturbed areas were removed from the roadless landscapes. Remaining landscape fragments were then excluded if their size was less than 50,000 hectares, or their width less than 10 kilometers (6 miles). High-resolution satellite imagery was not available at this stage for a considerable part of the studied landscape (the northern parts of Siberia and the Russian Far East). The analysis of these areas therefore had to be concluded at this stage (accuracy zone 3). The result of the second stage of the analysis was a map of candidate intact forest landscapes. Step 3. Reduction of the remaining area (candidate intact forest landscapes)by elimination of smaller linear and surface disturbances, visible in satellite images of high resolution (15-35 meters)Satellite images from three different sources were used at this stage of the analysis: Landsat-7 ETM+ (262 scenes), ASTER (1470 scenes), and Resurs-O1 MSU-E (516 scenes). In addition, images from SPOT-HVR (15 scenes) were used for a small part of the Murmansk region. Summer images were mainly used, but in their absence images from the winter, spring and fall seasons were also used.In the third and final stage of the analysis, the remaining set of candidate intact landscapes was reduced further by elimination of areas with surface disturbances that were either too small or too unclear to have been eliminated at earlier stages (see Table 2). Elongated, less than 2-kilometer wide, parts of intact forest landscapes were eliminated. Areas with smaller linear disturbances were also eliminated, along with remaining landscape fragments, which did not meet the requirements for minimum size or width.
Individual disturbed areas that were eliminated at this stage varied in size between 1-2 hectares (2.5-4.9 acres) and 10-20 hectares (25-49 acres), depending on the kind and age of the disturbance. The high-resolution images also made it possible to verify or correct the location of most linear elements of infrastructure. The result of this last phase of the analysis was a selection of internally un-fragmented forest landscapes without detectable signs of significant disturbance, larger than the minimum dimensions of 50,000 in size and 10 km in minimum width. The final map of intact forest landscapes was drawn based on the results of step 3 with the exception of the areas for which satellite images of high resolution were not available (accuracy zone 3).
Forest inventory information was used to support the interpretation of the high resolution images in step 3 (and were also used to some extent in step 2). Most of this information was in the form of generalized forest maps of leskhozes (local offices of the state forest management agency) at scales typically between 1:150,000 and 1:300,000. More detailed maps do exist in many cases but were not available to the study for reasons of price and limited public access. Even the less detailed maps were not available for some areas due to constraints in public access in combination with the physical dispersal of these maps (there is no central library with materials for the whole country).
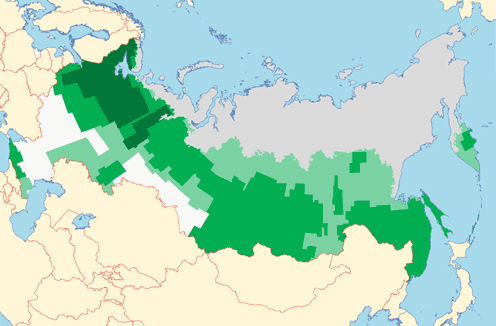
AccuracyThe map's accuracy varies for different parts of Russia, largely depending on the amount and quality of available information. Field expeditions were organized as part of this mapping project to verify the accuracy of the result. External researchers kindly shared data that was used for the same purpose. In most of northern European Russia (accuracy zone 1, Picture 8), high resolution images (15-30 meters) were used along with information from ground observations from a large number of sites (173 inventoried key areas). A big share of the southern parts of European Russia and Western Siberia were excluded either in step 1 or on the basis of reliable ground data along with scattered satellite images (zone 0). In the Caucasus and central European Russia, and in the southern parts of the Ural area, Siberia, and the Russian Far East (accuracy zone 2), the work was mainly based on high resolution images, but with a smaller number of ground observations. For some areas not covered by high resolution imagery reliable data were available from previous studies by project participants and external researchers. It is possible in this zone that individual areas may have been incorrectly classified, making an intact area out of a non-intact, or vice versa. Information from a total of 235 sites was used to verify the map within accuracy zones 2 and 3 together. In the remaining regions (the central and northern parts of Siberia and the Russian Far East, some areas in the east of European Russia and in the south of Siberia, accuracy zone 3) the work was mostly based on medium-resolution images (150-300 meters) and ground observations were rare. Instead, high resolution images were used to verify the interpretation of selected areas. Additional analysis, using ground observations and high-resolution images, is recommended before any management decisions are made concerning these areas. In the naturally highly fragmented tundra forests in the northernmost regions of Siberia and the Russian Far East (accuracy zone 4), the available information (low-resolution images and fragmented ground observations) was not sufficient to assess the degree of human transformation of the landscape accurately.
A large portion of this area has nevertheless been processed as part of the analysis (see The northern boundary of intact forest landscapes section Forests at the northern tree limit are extremely vulnerable to any disturbances, even those that are only indirectly related to humans. It would not be correct to assume that they are totally undisturbed, despite their remote location. These forests are shown as forested areas outside of the studied territory, and their boundaries are given in accordance with the Russian topographical maps at 1:500,000 scale of the Main Department of Geodesy and Mapping, most of which reflect the state of the area in the 1970 and 1980s. The analysis is more likely to overestimate the remaining intact area than to underestimate it. This is inherent in the very approach of the study, which assumes land to be intact unless signs of disturbance can be detected. Signs of disturbance are much more likely to have been missed than to have been mistakenly found where none exist, although this possibility can not be ignored. A sparse larch forest without needles in rocky terrain can be difficult to distinguish from fire scar. Ancillary information was used to decrease the risk of such mistakes, but a few may have occurred. The more likely mistake, however, is that signs of disturbance were not seen, particularly in those areas where high-resolution images were not available. Some types of intensive disturbance cannot be detected without such images.
| |||||||||||||||||||||||||||||||||||||||||||||||||||||||||||||||||||||||||||||||||||||||||||||||||||||||||||||||||||||||||||||||||||||||||
| |||||||||||||||||||||||||||||||||||||||||||||||||||||||||||||||||||||||||||||||||||||||||||||||||||||||||||||||||||||||||||||||||||||||||
|